|
|
|
|
|
2011-2012
Title I Programs Annual Report |
|
|
|
| Allocations for Fiscal Year 2012 |
$ |
499,003,266.00 |
|
| Additional Allocations |
$ |
3,529,983.00 |
|
| Carryover from Previous Year |
$ |
0.00 |
|
| Total |
$ |
502,533,249.00 |
|
|
|
|
|
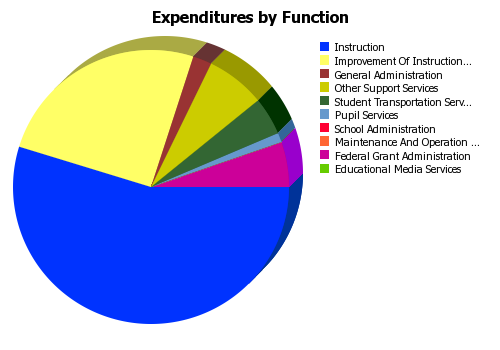
| Instruction |
$ |
250,182,763.00 |
|
| Improvement Of Instructional Services |
$ |
116,291,181.00 |
|
| School Administration |
$ |
403,849.00 |
|
| General Administration |
$ |
10,106,523.00 |
|
| Educational Media Services |
$ |
90,332.00 |
|
| Student Transportation Service |
$ |
20,596,313.00 |
|
| Pupil Services |
$ |
4,052,866.00 |
|
| Other Support Services |
$ |
31,764,840.00 |
|
| Maintenance And Operation Of Plant Services |
$ |
35,987.00 |
|
| Federal Grant Administration |
$ |
24,052,695.00 |
|
| Total |
$ |
457,577,349.00 |
|
|
|
|
|
|
|
| Elementary |
1002 |
341 |
|
| Middle School |
341 |
148 |
|
| High School |
216 |
240 |
|
| Total |
1559 |
729 |
|
|
|
|
| Number of Schools Offering a Flexible Learning Program (FLP) |
0 |
N/A* |
|
| District Effectiveness |
0 |
N/A* |
|
|
|
|
| Highest-Performing Rewards Schools |
817 |
N/A* |
|
| High-Progress Rewards Schools |
0 |
N/A* |
|
| Sub Total |
817 |
N/A* |
|
| Priority |
68 |
N/A* |
|
| Focus |
146 |
N/A* |
|
| Sub Total |
214 |
N/A* |
|
| Total |
1031 |
N/A* |
|
|
|
|
| Elementary Student Attendance Rate |
96.6% |
97.1% |
|
| Middle School Student Attendance Rate |
96.1% |
96.7% |
|
| High School Student Attendance Rate |
93.8% |
95.0% |
|
| 4-Year Cohort Graduation Rate |
62.9% |
76.7% |
|
| 5-Year Cohort Graduation Rate |
63.9% |
77.6% |
|
|
|
|
| Criterion Referenced Competency Test (CRCT) |
|
|
|
| CRCT Mathematics |
80.5% |
91.7% |
|
| CRCT Reading |
92.4% |
97.5% |
|
| CRCT English Language Arts |
90.0% |
96.1% |
|
| CRCT Science |
73.1% |
88.2% |
|
| CRCT Social Studies |
72.0% |
88.3% |
|
| End of Course Tests (EOCT) |
|
|
|
| EOCT 9th Grade Literature |
77.8% |
88.3% |
|
| EOCT American Literature |
84.3% |
92.2% |
|
| EOCT Coordinate Algebra/GPS Algebra/Mathematics I |
56.4% |
72.9% |
|
| EOCT GPS Geometry/Analytic Geometry |
47.5% |
66.7% |
|
| EOCT Physical Science |
69.8% |
80.3% |
|
| EOCT Biology |
62.7% |
78.9% |
|
| EOCT US History |
59.2% |
74.6% |
|
| EOCT Economics |
69.0% |
82.7% |
|
|
|
|
|
|

