|
|
|
|
|
2012-2013
Title I Programs Annual Report |
|
|
|
| Additional Allocations 2013 |
$ |
5,049,623.00 |
|
| Allocations for Fiscal Year |
$ |
481,868,730.00 |
|
| Carryover from Previous Year |
$ |
0.00 |
|
| Total |
$ |
486,918,353.00 |
|
|
|
|
|
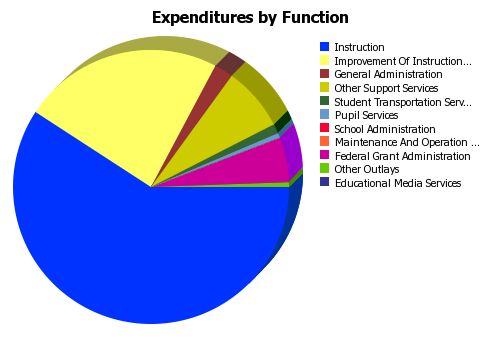
| Instruction |
$ |
280,399,598.00 |
|
| Improvement Of Instructional Services |
$ |
112,308,844.00 |
|
| Other Outlays |
$ |
2,170,272.00 |
|
| School Administration |
$ |
78,073.00 |
|
| General Administration |
$ |
10,777,257.00 |
|
| Educational Media Services |
$ |
163,298.00 |
|
| Student Transportation Service |
$ |
4,742,624.00 |
|
| Pupil Services |
$ |
3,042,043.00 |
|
| Other Support Services |
$ |
34,919,836.00 |
|
| Maintenance And Operation Of Plant Services |
$ |
39,800.00 |
|
| Federal Grant Administration |
$ |
25,337,707.00 |
|
| Total |
$ |
473,979,352.00 |
|
|
|
|
|
|
|
| Elementary |
986 |
347 |
|
| Middle School |
346 |
143 |
|
| High School |
217 |
231 |
|
| Total |
1549 |
721 |
|
|
|
|
| Number of Schools Offering a Flexible Learning Program (FLP) |
186 |
N/A* |
|
| District Effectiveness |
72 |
N/A* |
|
|
|
|
| Highest-Performing Rewards Schools |
66 |
N/A* |
|
| High-Progress Rewards Schools |
0 |
N/A* |
|
| Sub Total |
66 |
N/A* |
|
| Priority |
60 |
N/A* |
|
| Focus |
147 |
N/A* |
|
| Sub Total |
207 |
N/A* |
|
| Total |
273 |
N/A* |
|
|
|
|
| Elementary Student Attendance Rate |
95.9% |
96.5% |
|
| Middle School Student Attendance Rate |
95.7% |
96.4% |
|
| High School Student Attendance Rate |
93.5% |
95.1% |
|
| 4-Year Cohort Graduation Rate |
65.7% |
78.8% |
|
| 5-Year Cohort Graduation Rate |
66.7% |
79.5% |
|
|
|
|
| Criterion Referenced Competency Test (CRCT) |
|
|
|
| CRCT Mathematics |
81.8% |
92.2% |
|
| CRCT Reading |
93.2% |
97.7% |
|
| CRCT English Language Arts |
89.0% |
95.7% |
|
| CRCT Science |
74.4% |
88.3% |
|
| CRCT Social Studies |
76.0% |
89.7% |
|
| End of Course Tests (EOCT) |
|
|
|
| EOCT 9th Grade Literature |
79.0% |
90.2% |
|
| EOCT American Literature |
86.1% |
93.5% |
|
| EOCT Coordinate Algebra/GPS Algebra/Mathematics I |
38.3% |
66.7% |
|
| EOCT GPS Geometry/Analytic Geometry |
53.5% |
70.6% |
|
| EOCT Physical Science |
75.3% |
85.9% |
|
| EOCT Biology |
65.0% |
80.2% |
|
| EOCT US History |
62.4% |
78.4% |
|
| EOCT Economics |
71.8% |
83.5% |
|
|
|
|
|
|

